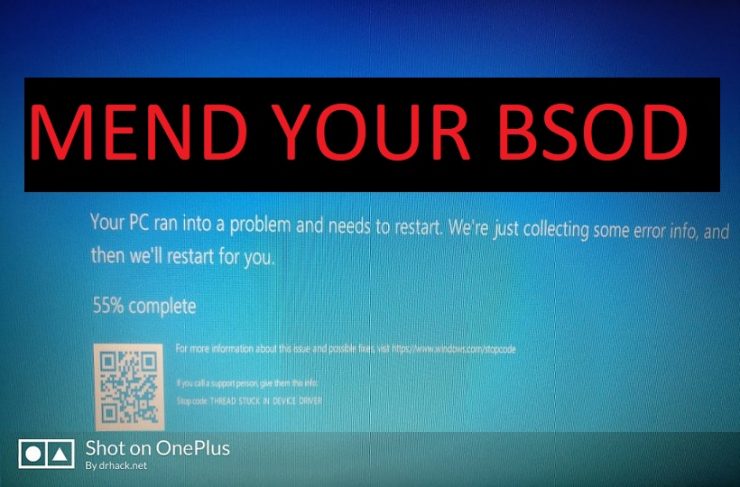
Being into the tech world I often get emails and Facebook queries where people tell me that they saw the famous ” Blue Screen of Death” a.k.a BSOD. Many people are told that its a faulty RAM or HDD , even I agree as in most cases these are the culprits but how can one say the same without pin-pointing the “culprit“.
Windows provide very thorough technical detail about the error through a Memory Dump (mini dumps included) function, most of our requirements are fulfilled by analyzing the mini dump
Note: This method is applicable on all versions of Windows 10 and Windows 11.
What is a Mini Memory Dump
If your computer crashes, how can you find out what happened, fix the issue and it prevent it from happening again? You may find the mini memory dump file useful in this situation. The mini memory dump file contains the smallest amount of useful information that could help you identify why your computer crashed. The memory dump file contains the following information:
- The Stop message, its parameters and other data
- A list of loaded drivers
- The processor context (PRCB) for the processor that stopped
- The process information and kernel context (EPROCESS) for the process that stopped
- The process information and kernel context (ETHREAD) for the thread that stopped
- The Kernel-mode call stack for the thread that stopped
Windows keeps a list of all the mini memory dump files in the %SystemRoot%\Minidump folder.
The mini memory dump file can be useful when hard disk space is limited. However, because of the limited information that is included, errors that were not directly caused by the thread that was running at the time of the problem may not be discovered by an analysis of this file.
In this article I will share the lazy method of getting the memory dump and sending the same for analysis to Microsoft Support Forum, you wouldn’t believe how active they are. Few months back one of my Laptop started showing the BSOD Error after i tested out heavy crypto mining , I will also use the same laptop as reference for fixing the crash screen, 0x00000124 bug check or stop error as it is known on Windows 10 / Windows 11
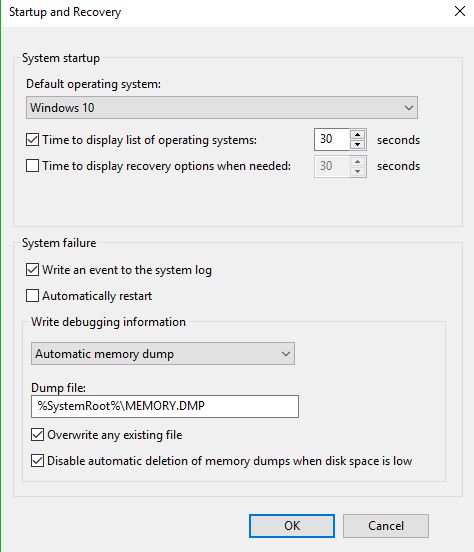
Turn on Memory Dumps
Memory dump is turned on by default but if you can not find the mini dump or full dump you may turn them on.
- Go to Start, in the Search Box type: sysdm.cpl and press Enter.
- Under the Advanced tab, click on the Startup and Recovery Settings button.
- Ensure that Automatically restart is unchecked.
- Under the Write Debugging Information header select Small memory dump (256 kB) in the drop down box (the 256kb varies) and for Windows 10 / 11 use “Automatic Memory DMP“
- Ensure that the Small Dump Directory is listed as %systemroot%\Minidump.
- Save changes and exit, reboot if asked.

Smart Method – BSOD Analysis
Step 1 – Collect Memory Dump File: Navigate to C:\Windows\Minidump and drag the contents to your desktop. If the minidump folder is not there or empty there may be a larger DMP file located at C:\WINDOWS called MEMORY.DMP which can also use be used.
Note :
- If you have minidumps use them FIRST
- Only upload the full dump file (MEMORY.DMP) if there are no minidumps
- Upload 3 most recent DMP files but if you have less it would work.
- DMPs should not more than 30 days old
Step 2 – Zip the Dumps: Zip up the files using winzip etc.
Step 3 – Upload for Sharing : Upload them to a file sharing service like OneDrive or Google Drive or any other file sharing service as we will need to link the uploaded dmps in our next step.
Step 4 – Collecting MSInfo32 : Go to Start > Run >MSinfo32.
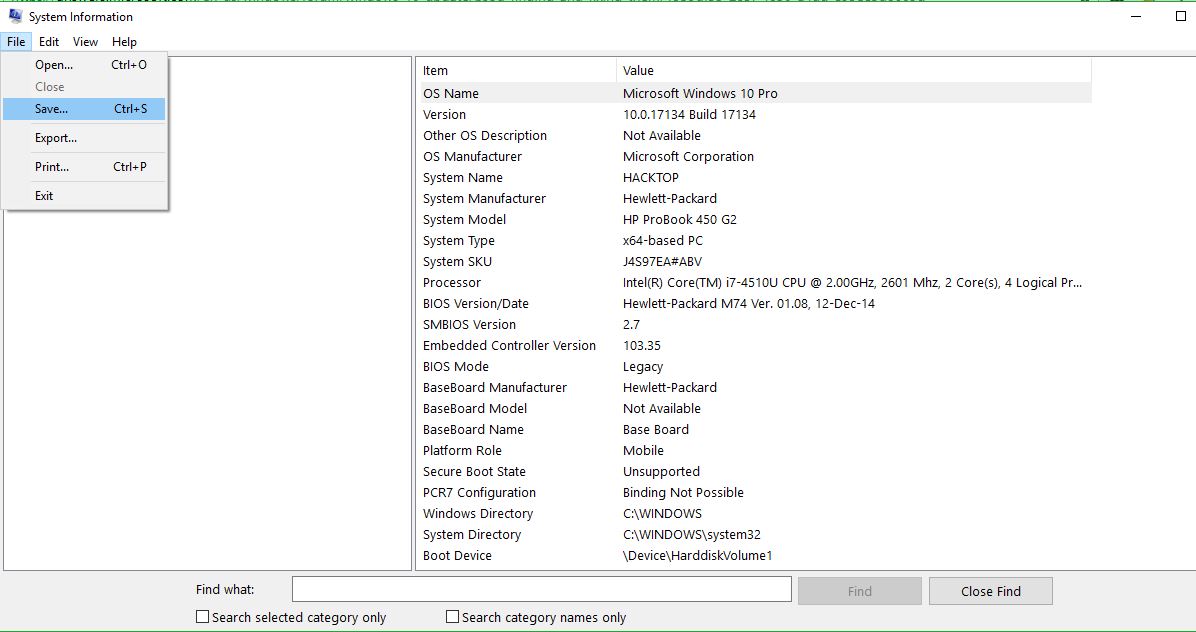

Go to File > Save and upload the saved file with the DMPS which you uploaded in Step 3
Step 5 – Ask Microsoft to analyse : Ask a Question on Microsoft Support Community. While asking your question ensure that your upload links of memory dump and msinfo file. In Category select Windows and Performance and System Failures under Windows Topics
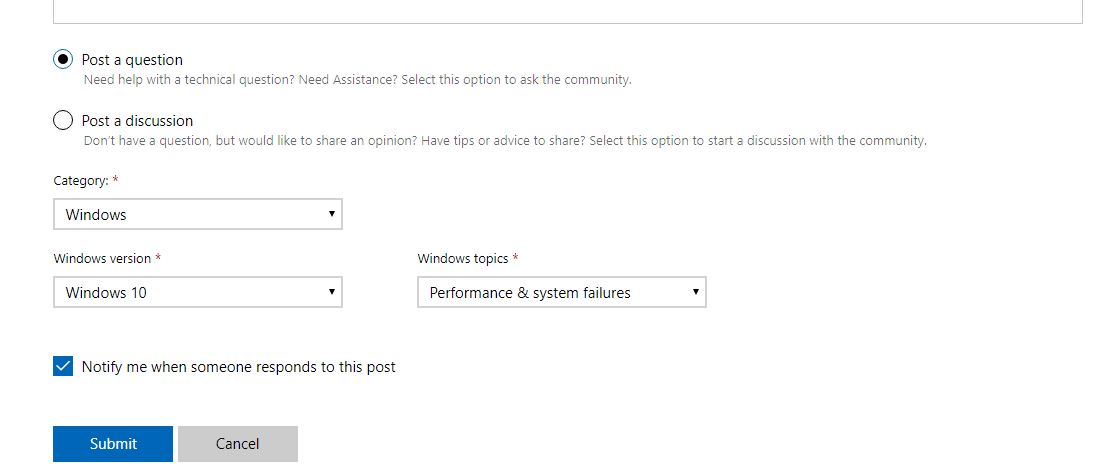

Step 6 – Fix your Errors : Once replied you will be given direct source of issue and a way to resolve your issues .
MiniDump Analyzer – DIY
Although this post explains the lazy and smart way of sharing the information in proper way which will get you the right support, but what if you want to it yourself ?
There are many dump file analyzer tools which let you read minidump files, bluescreenview is one of the simplest and easiest to go about. Although Windows 10 / Windows 11 provide more debugger tools but in my opinion BlueScreenView is far better because of its simpler use, How to Use BlueScreenView has been explained below
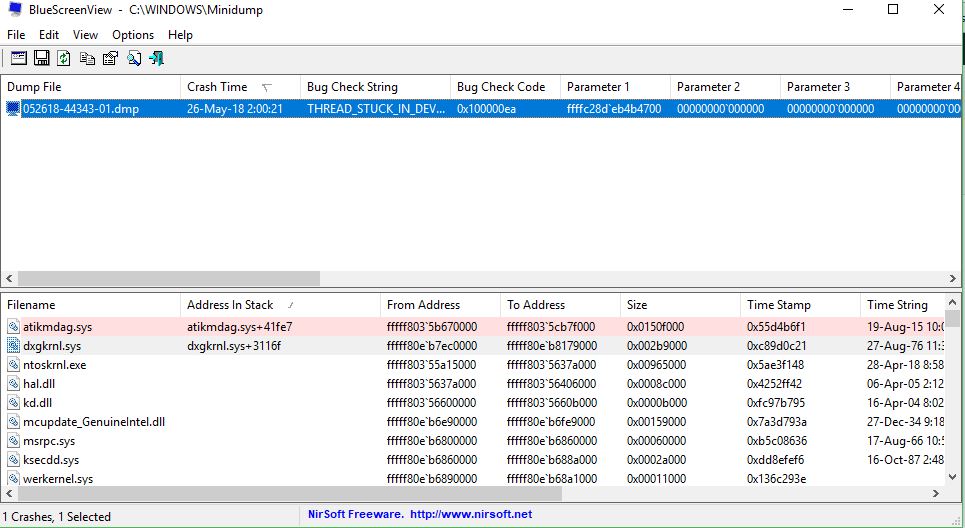

How to Read Dump Files in Windows 10/11 : Just download BlueScreenView and run it , it will simply show you the culprit file which caused the stop code error at certain address , a quick google search against the same file (mostly .dll files i.e. hal.dll etc)
Opening / Analyzing Memory Dump Files
Standard windows text editors will not open .dmp files. Download and install Windows Driver Kit for Windows 10/11.
After you have installed WDK for Windows 10/11:
- Open the Start menu
- type
windbg.exe. - Click File and select Open Crash Dump
- Browse to the .dmp file you wish to analyze
- Click Open
The file will load with view-able content. Microsoft community would still be able to provide you great added information and help on this as shared above.
If you are still stuck you can ask on Ask Techie! , I can analyze your Windows Memory Dumps and let you know the culprit files.




[…] Source link […]
[…] Bật bộ nhớ DUMP trên Windows 10 thông qua tùy chọn khởi động và khôi phục […]